
About
I turn operational data into dashboards that teams use every day. I have 6+ years of experience in logistics, legal, finance and manufacturing, including 2 years working remotely with a US-based company.
Power BI Projects
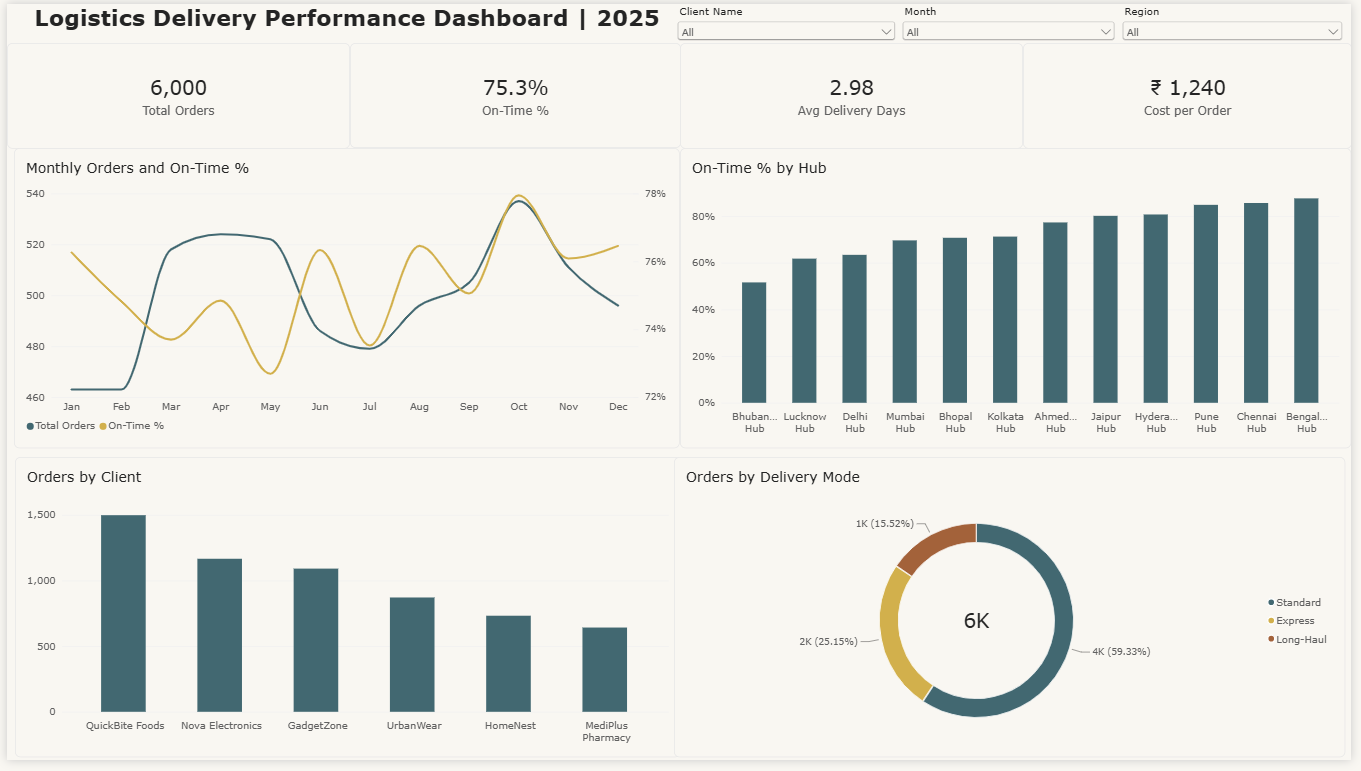
Logistics Delivery Performance Dashboard
Tracks on-time delivery, delivery days and cost per order for 6,000 orders across 12 hubs and 6 clients in 2025. Filters by region, client and month.
What it shows:
- Overall on-time delivery is 75.3%, with an average of 2.98 days per delivery
- Bhubaneswar Hub has the lowest on-time rate (about 52%) and Bengaluru Hub the highest (about 88%)
- Order volume peaks in October, and QuickBite Foods is the largest client
What I did: Cleaned the data in Power Query (removed duplicates, fixed text case and extra spaces), built a star-schema model with a date table, and wrote DAX measures for on-time %, average days and cost per order.
Tools: Power BI, Power Query, DAX, Data Modeling
Built on synthetic data for portfolio practice.
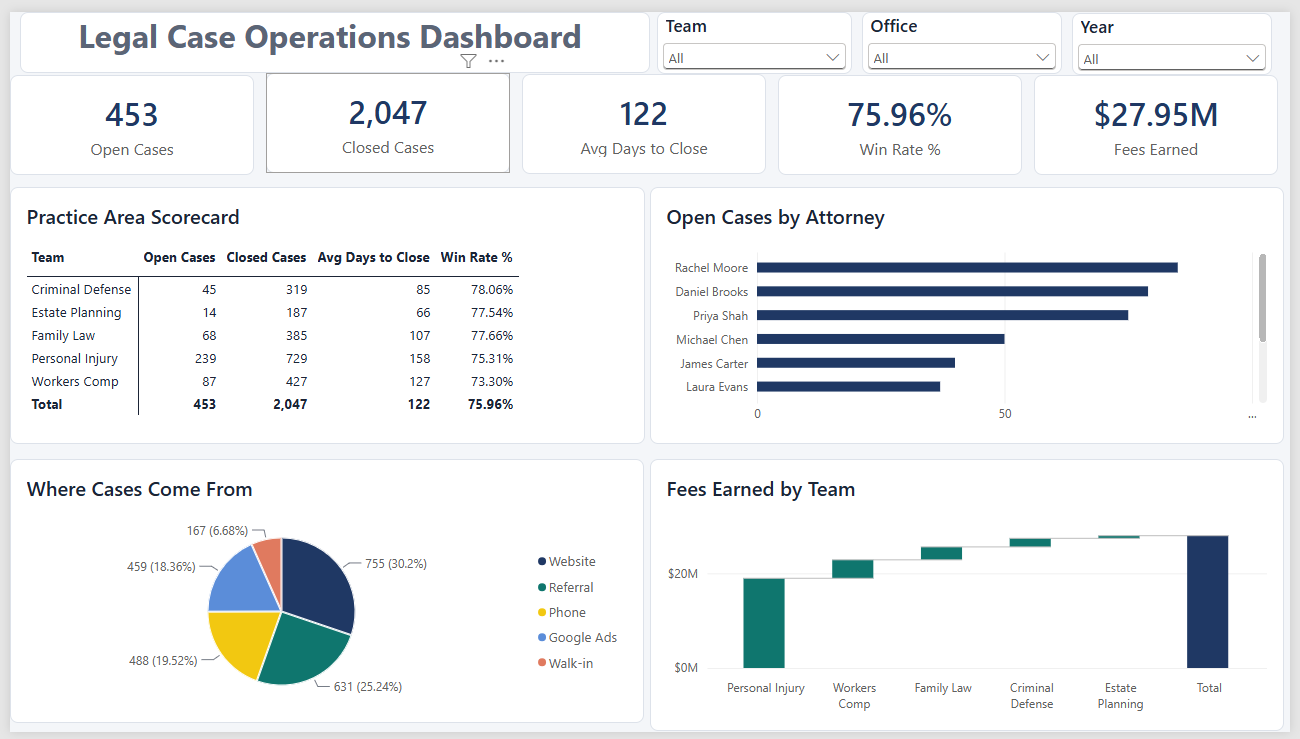
Legal Case Operations Dashboard
Tracks 2,500 cases across 10 attorneys and 5 practice areas (2024–2025): open and closed cases, time to close, win rate and fees. Filters by team, office and year.
What it shows:
- Personal Injury earns the most fees but is also the slowest to close (158 days on average) and holds over half of all open cases
- Estate Planning closes fastest (66 days), and Criminal Defense has the highest win rate (78%)
- The website brings in the most new cases (30%), followed by referrals (25%)
What I did: Cleaned the case data in Power Query and added a days-to-close column, linked a date table to both open and close dates, and used an inactive relationship with USERELATIONSHIP in DAX to count cases by the date they closed. Built a practice area scorecard with a matrix visual.
Tools: Power BI, Power Query, DAX, Data Modeling
Built on synthetic data for portfolio practice.
Recommendations
He was meticulous in his work and someone I could genuinely depend on. He took the time to understand the details, think through his analysis carefully, and make sure the work was solid before putting it forward. He was also calm and confident when presenting his work… comfortable walking senior leadership through his findings and answering questions.
I highly recommend him as an outstanding colleague and collaborator. He is always willing to listen and offers valuable insights. His proficiency in Google Sheets, Power BI, and SQL showcases his strong analytical skills, making him a great asset to any team.
What I do
Build dashboards
Power BI with DAX and Power Query
Write SQL
Joins, CTEs and window functions for clean reports
Lead teams
Led 8 analysts across 53+ centers, KPI from 60% to 94%
Work remotely
2 years with a US-based company
Tools: SQL · Power BI · Salesforce · Tableau · Excel
Contact
Open to remote Data Analyst and BI roles.
Email: Ankitnamdev09@gmail.com
WhatsApp: +91 81095 95862